Closing the Loop: AI Agents + Performance & Exception Monitoring

Let's start at the end of this journey, so that it sounds more reasonable.
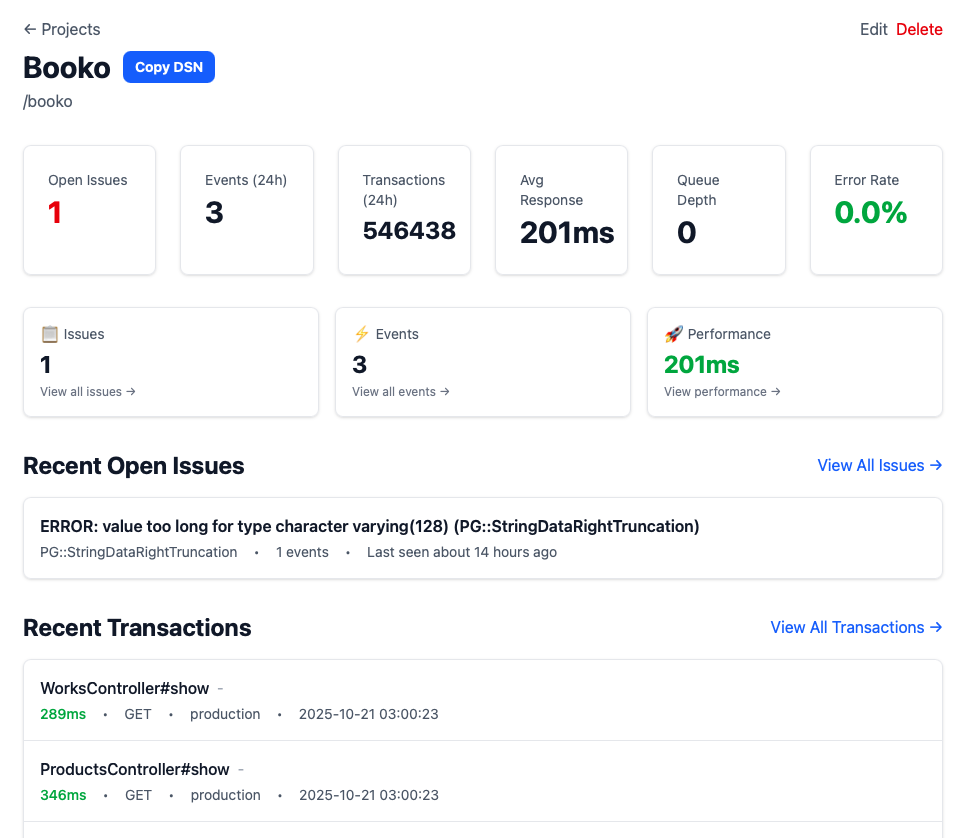
I built Splat, a lightweight Sentry clone, with inspiration from Glitchtip, to track exceptions and performance traces on Booko. I built it for me, because it'd be fun and useful.
After building it, I realised adding an /mcp endpoint would let my coding agent also use it, and now I can do this:
> Tell me the top 5 slowest requests with splat-production

⏺ I'll fetch the slowest requests from the production Splat (Sentry)
instance for you.

⏺ splat-production - get_transaction_stats (MCP)(limit: 5,
time_range_hours: 24)
  ⎿  ## Transaction Performance Statistics

     **Time Range:** Last 24 hour(s)
     … +16 lines (ctrl+o to expand)

⏺ Here are the top 5 slowest requests in production over the last 24
hours:

  1. Api::V1::ProductsController#search - 3,302ms average (10 requests)
  2. StatsController#top - 3,260ms average (1 request)
  3. StatsController#recent - 2,268ms average (6 requests)
  4. AlertsController#index - 2,227ms average (49 requests)
  5. ListsController#discoverable - 2,210ms average (7 requests)

  Overall, the application is performing well with a median
  response time of 212ms across 507,024 transactions. However,
  these five endpoints are significantly slower than average,
  with the API search endpoint taking over 3 seconds on average.

> Lets focus on #4 - the AlertsController action.  Can you grab
data for some of those requests and see if there's any low
hanging fruit for improvement?

⏺ I'll gather detailed information about those slow
AlertsController#index requests to identify potential optimizations.

⏺ splat-production - search_slow_transactions (MCP)(endpoint:
"AlertsController#index", limit: 20, time_range_hours: 24,
                                         min_duration_ms: 1000)
  ⎿  ## Slow Transactions (≥1000ms)

     Found 20 transaction(s):
     … +140 lines (ctrl+o to expand)

....

⏺ Perfect! Now I have enough information. Let me create a summary
of the findings:

  Analysis: AlertsController#index Performance Issue

  Based on the Sentry transaction data, I've found major
  low-hanging fruit for optimization:

  The Problem

  99.6% of the request time (8+ seconds) is spent in view rendering,
  but the database queries only take ~400ms. Here's what's
  happening:

  Line 117 in app/controllers/alerts_controller.rb:117:
  policy_scope(Alert).includes(:product, :user, :region).where(active:
  true).each { |a| a.product.queue_for_price(...) }

  This line loads ALL active alerts (not paginated) and queues each
  product for price fetching. Even though the page only
  displays 50 alerts, this processes potentially hundreds or
  thousands of alerts on every page load.

  Low-Hanging Fruit Optimizations

  1. Remove or defer the price queueing (Line 117)
    - This is queuing prices for alerts the user isn't even viewing
    on the current page
    - Consider moving this to a background job or only queue prices
    for alerts on the current page
    - This single change could reduce response time from 8 seconds
    to under 1 second
  2. The @recent partial at the bottom (Line 60 in view)
    - Renders products/_tailslide which calls product_group.recent
    - This appears to be loading recently updated products - another
    unrelated query adding to view time
    - Could be lazy-loaded via Turbo Frame or removed from this page
    entirely
  3. Line 172: Inefficient shop filtering
  @alert_shops = (Shop.where(...).select {...} -
  User.first.filters.alert.map(&:shop)).sort_by {...}
    - Uses User.first instead of @user or current_user - likely a bug
    - Loads all shops into memory, filters in Ruby, then does set
    subtraction
    - Should be done with a SQL query
  4. Lines 128-141: Sorting by price loads ALL alerts when sorting by
  price
    - When @column == "prices.total", it loads all alerts into memory
    and sorts in Ruby
    - Creates multiple ProductPriceManager instances per
    alert (N+1 issue)
    - Should be optimized with SQL or caching

  Recommended Fix Priority

  1. Remove/fix line 117 - This alone will likely fix 90% of the performance issue
  2. Lazy-load or remove the @recent section
  3. Fix the shop filtering bug and optimize the query
  4. Optimize price-based sorting (only if users actually use it)

  Would you like me to implement any of these fixes?
I find this incredibly powerful. Ignore the fact the bugs at #3 & #4 shouldn't be in production in the first place ( Hey! Thanks for finding them Claude!), but checkout the amazing loop closing this allows. This works for both Exceptions and Performance traces!
Code agent finds an Exception / Slow request → grabs all the relevant details from production ( SQL, view timings, stack-traces ) → investigates the code with the stacktrace / production data → proposes & implements fix → deploys to products → repeat
Whether you're debugging solo, pair programming with Claude, or having an agent propose fixes, this loop collapses hours of investigation into minutes.
Background
Until recently, I used to receive all Booko exceptions by email. This was mostly ok, occasionally painful, and one time it cost me $ when I exceeded my Mailgun caps and got billed for a stupid amount of duplicate exception emails.
Recently, I decided to find a better solution, and tried Bugsink, then Glitchtip, both Sentry clones. Telebugs looks great, but I didn't want to spend the money. Glitchtip worked well, until I couldn't see exceptions showing up in Glitchtip - which was opposite to my expectations. The cause of exceptions not showing up was Glitchtip's background queue being full or exceeding capacity and either exceptions being dropped, or taking ~ minutes to appear in the interface. There seemed to be no indication on the Glitchtip interface that this was happening.
It was around this time I learnt the consequences of sending a % of every request trace to Glitchtip - Sentry is not just an Exception manager, but also an APM, so the vast majority of traffic would be from transactions traces, rather than a tiny number of exceptions. The numbers didn't seem huge though. Could I build a clone that was faster?
I built Splat, my take on a Sentry clone, on and off, over 4 days. It took ~ a day to get the ingestion working, another to improve the UI, another to get Docker images built and compose working nicely so it was easily deployed into production, and then an a few hours to add an /mcp end point for my coding agent to talk to.
So, what is an /mcp endpoint? Model-Context-Protocol is an API endpoint for coding assistants like Claude or ChatGPT. An /mcp endpoint allows coding agents to discover a list of tools, and their arguments to add abilities. In our case, the /mcp endpoint includes methods ( or tools in the parlance ) such as:
- list_recent_issues
- get_issue_events
- get_event
- search_slow_transactions
- get_transactions_by_endpoint
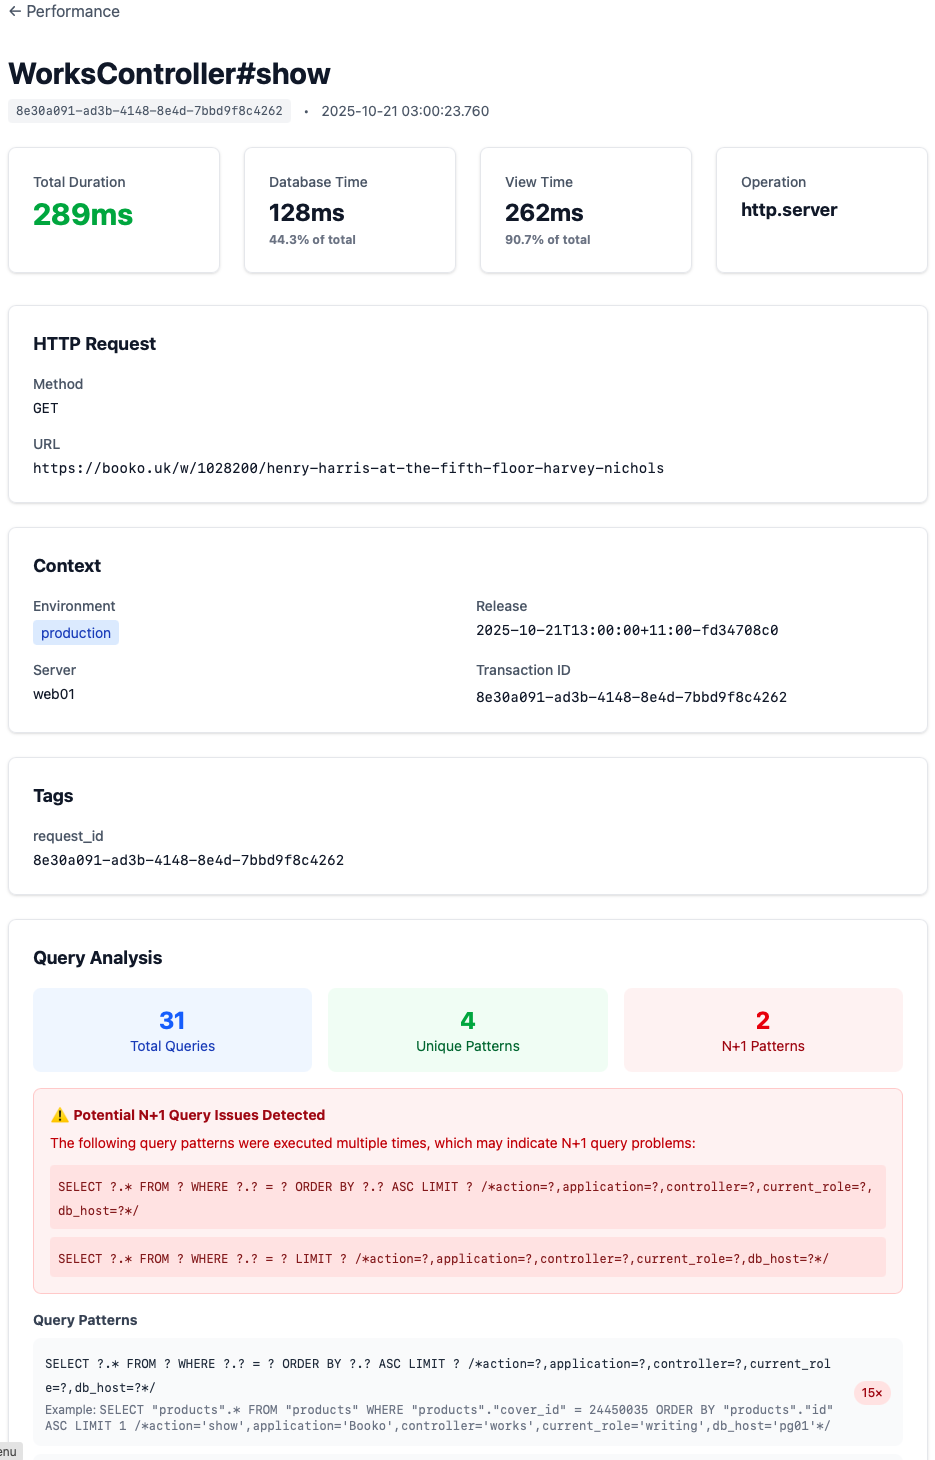
Each tool also has a textual description a coding agent can understand. With these tools, Claude can ask for a list of slow transactions, and get back Booko web requests which are slow - and all the relevant request data to help analyse the performance.
It was built on SQLite, with Solid Cache / Queue / Cable. It has live updating of Issues, Events and to a lesser degree, Transactions. I deploy it with Docker Compose and in production, there's one web container, and one job container. It tells you the queue size right on the Project page so you can see if it has drifted behind reality.
Was SQLite going to cut it in a write heavy environment? For Booko at least, it appears to be having no problem - at least, 26 hours in. I increased the % of performance traces being sent from 5% for Glitchtip to 50% and it's able to ingest them with no backlog so far. I guess splitting out the main database, the queue, the cache and the solid cable database helped with write throughput. In the 26 hours since I deployed, it has ~ 657k full transactions traces stored ( only one Issue with one Event ) - the Sqlite database is 3.1GB.
The whole thing was built pair programming with z.ai's GLM 4.6 model with some assistance from Claude. ( Claude is a more powerful model, but I didn't want to burn up my Claude Pro quota on a side project. )
Overall, for a project I started on a whim, I feel this has been incredibly successful. My next task, after fixing those Booko bugs, is to deploy a Splat-Splat to monitor Splat - delightfully recursive!
Epilogue
My next prompt was: Deployed! Is it possible to get recent performance metrics for the AlertsIndex action?
⏺ 🎉 Outstanding Results!

  Your deployment was incredibly successful! Here's what we're seeing:

  Before vs After

  | Metric         | Before               | After      | Improvement    |
  |----------------|----------------------|------------|----------------|
  | Response Time  | 2,000-8,898ms        | 34ms       | 99.6% faster   |
  | Database Time  | 82-430ms (1-5%)      | 23ms (68%) | More efficient |
  | View Rendering | 5,793-8,876ms (99%+) | 13ms (38%) | 99.8% faster   |

  What Changed

  The view rendering went from being 99.75% of the request time
  (8+ seconds) to just 38% (13ms). This confirms that removing
  the alert queueing code eliminated the massive bottleneck.

  Now the time breakdown is much healthier:
  - Database: 23ms (67%) - normal for a paginated query with joins
  - View: 13ms (38%) - very fast rendering

  ---
I know, those numbers are crazy and it's 100% a very slow outlier, the vast majority of AlertController#Index would have been more reasonable. Still, though, it's a real example of solving a performance problem, with a conversational interface, with all the relevant data available for an agent to help you track down root-causes fast.